Even and odd functions both display types of symmetry. Even functions show symmetry over the y-axis, and odd functions show symmetry about the origin.
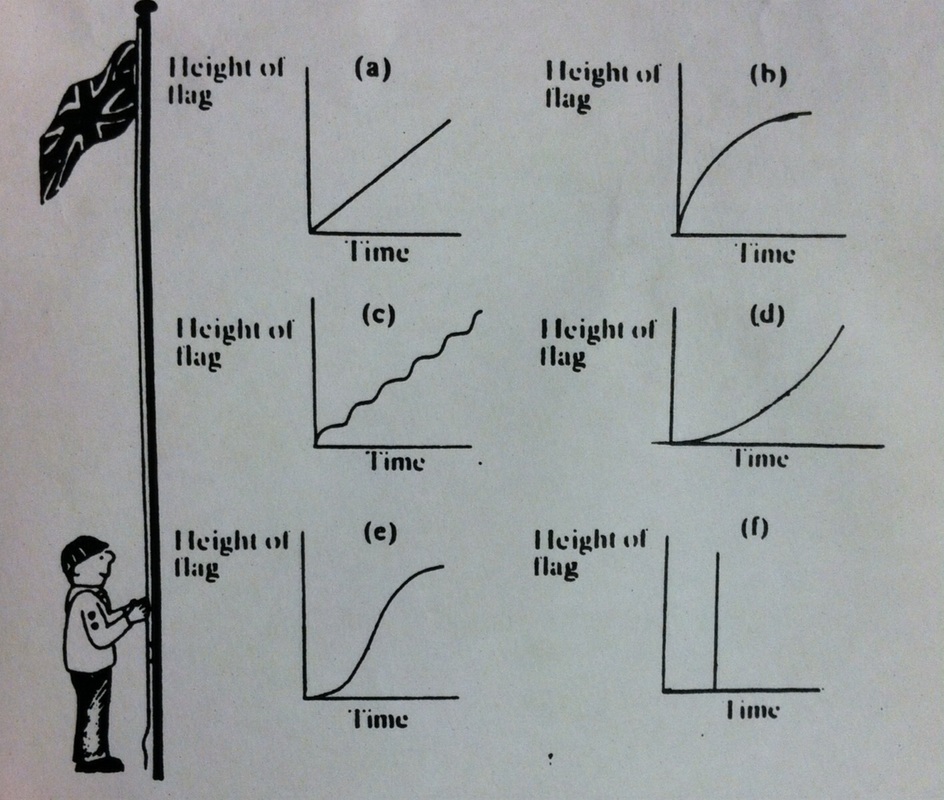 Each of the graphs above shows how the height of the flag changes over time.
(a) the flag is being raised at a constant speed (b) the height of the flag raises quickly, then slows once it is closer to the top of the pole (c) this graph shows the flag steadily rising and stopping momentarily until it reaches the top (d) in the beginning of the graph the flag rises slowly, then it gradually rises faster (e) the flag rises slowly, much quicker, then slowly again (f) for a short period of time the flag stays stationary, then it is immediately at the top of the pole Graph "c" is the most realistic graph for this situation. The incline indicates the rising of the flag, and the plateau represents the time between pulls on the rope. The least realistic graph for this situation is graph "f." It is physically impossible to be in one place and then another, without any time passing. 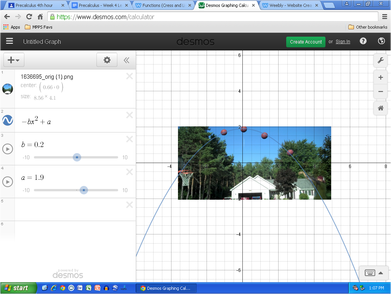 The point of this assignment was to use the desmos.com graphing calculator to predict whether or not the basketball would make it into the hoop. I used the equation -0.2x^2 + 1.9 for my prediction. Based on the graph I made, I think that the basketball will hit the back edge of the hoop and bounce off.
|
