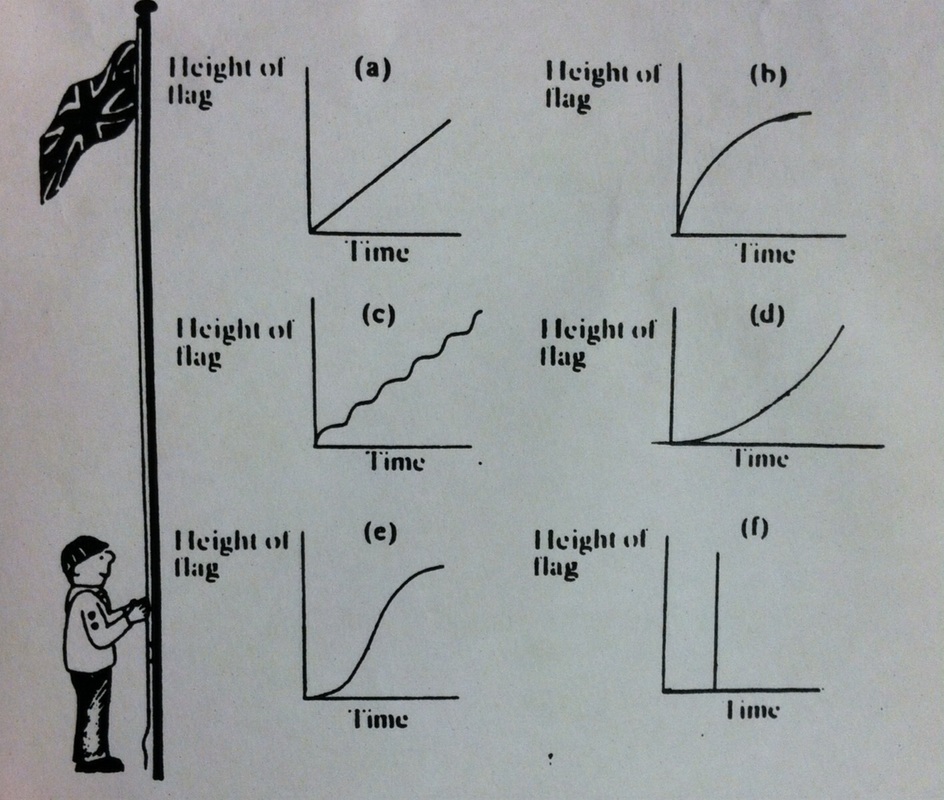
Each of the graphs above shows how the height of the flag changes over time.
(a) the flag is being raised at a constant speed
(b) the height of the flag raises quickly, then slows once it is closer to the top of the pole
(c) this graph shows the flag steadily rising and stopping momentarily until it reaches the top
(d) in the beginning of the graph the flag rises slowly, then it gradually rises faster
(e) the flag rises slowly, much quicker, then slowly again
(f) for a short period of time the flag stays stationary, then it is immediately at the top of the pole
Graph "c" is the most realistic graph for this situation. The incline indicates the rising of the flag, and the plateau represents the time between pulls on the rope.
The least realistic graph for this situation is graph "f." It is physically impossible to be in one place and then another, without any time passing.
